Choropleth Mapmaker Open Source tool for making Responsive Choropleth maps
Welcome to the second week of Storytelling with Data.
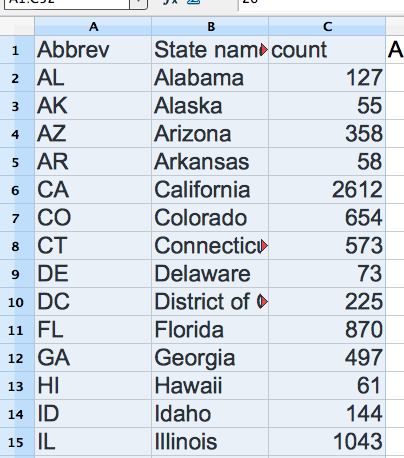
Open up the exported spreadsheet you created and copy everything in the Abbrev, State name, and count

Go to http://patrickgarvin.com/maps/USmap.htm and paste what you've copied into the appropriate data field.

Follow the directions. Click the column in 4. and choose colors and number range.
Grab the code and you can put it into code.js and follow the instructions at the top of the page to create a choropleth map using the included html, css, and javascript files.
Preview the map code
Visit http://codepen.io/anon/pen/dpIwc and paste in the generated javascript from before into the top of the JS box on the left.
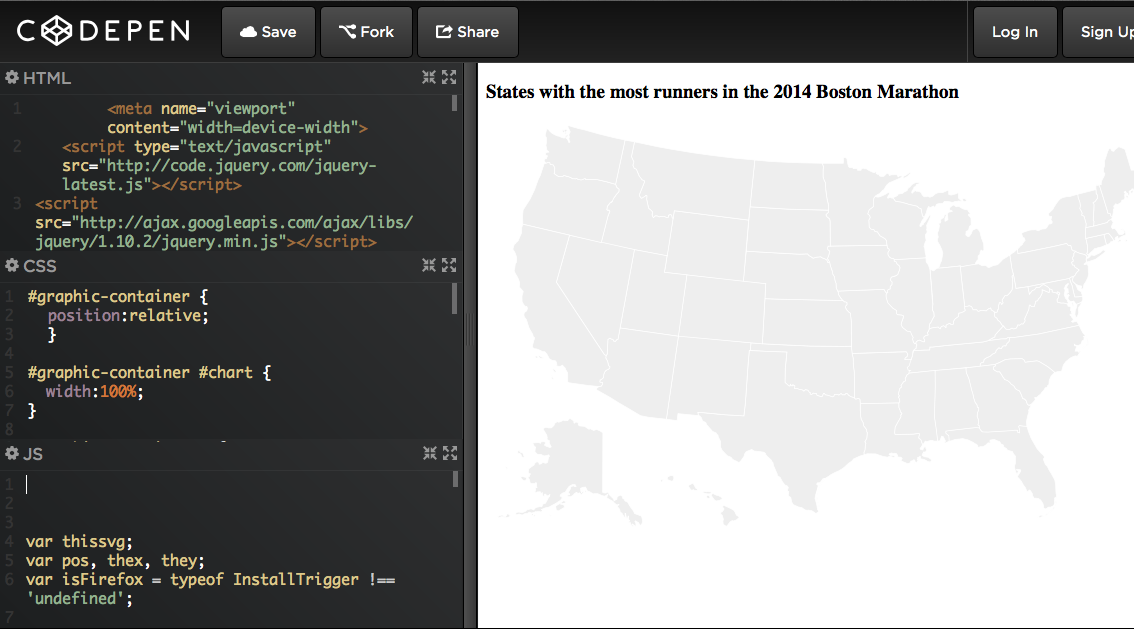
Congrats, you've made a choropleth map!